I work with geographic and remotely sensed data and then apply data analysis methods and geotechnologies to them to get visualizations, digital maps and information for management decisions within a broader Digital Earth vision
My name is Hira Zafar and I am from Pakistan.I did Geo-informatics Engineering from National University of Sciences and Technology.I proved to be the brightest student of my class and earned the President’s Gold Medal for academic excellence.
My first job was at an international consulting organization as a GIS officer. There I worked on an initiative of Water and Sanitation Services Company, Mardan for addressing SDGs of "clean water and sanitation", "Industry, Innovation and Infrastructure". I have worked as a GIS analyst at TPL Maps which is Pakistan's first indigenous digital mapping company providing GIS-based scalable solutions. There I worked on data innovation and data quality assurance.
I have always wanted to pursue a master’s degree which can equip me with the skills required to effectively design and implement real world problem solutions with a strong emphasis on socio-economic problems and sustainable development challenges faced by developing economies like ours and I am honored to earn the prestigious Erasmus Mundus Scholarship for their joint master degree program Masters in Digital Earth.
However, this is merely a beginning, for I aspire to achieve much more. Despite a productive work experience, I continue to have thirst for the knowledge to give back to the community, to make Pakistan a better place to live, and most importantly to prove what really matters is not where one comes from, but where one’s heading.
Replacing Human Decision Making with more sophisticated technologies.
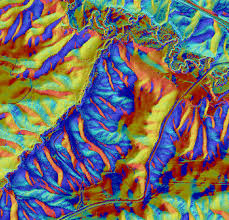
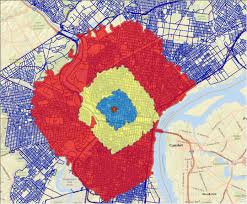
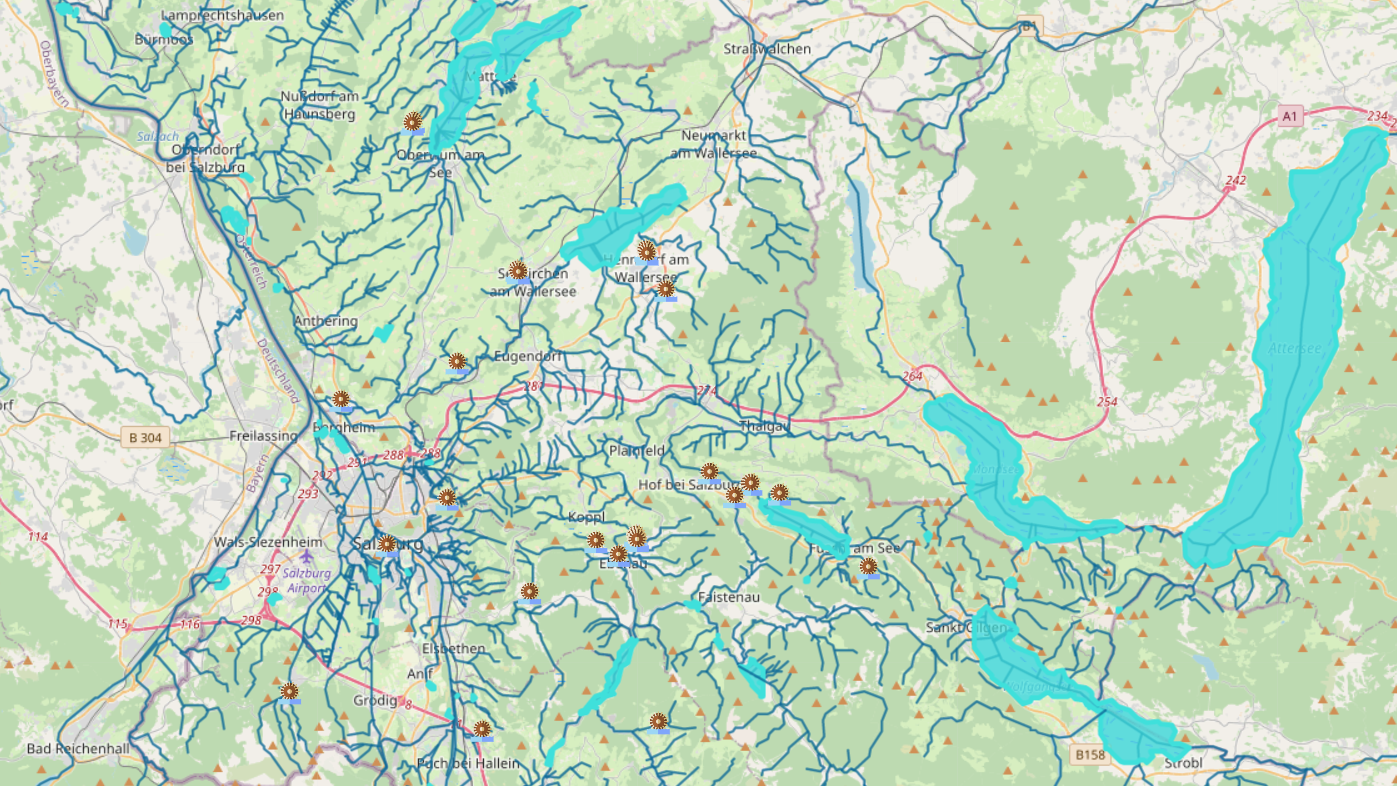
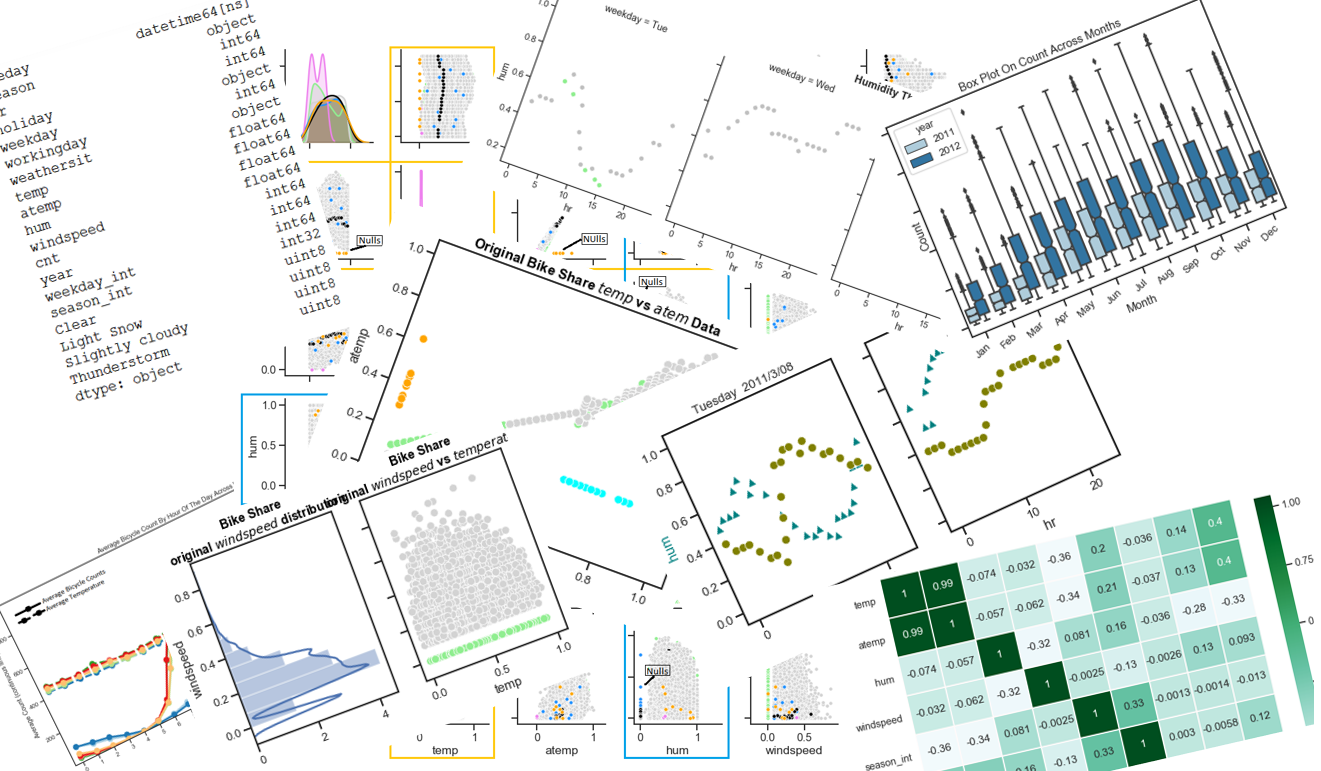
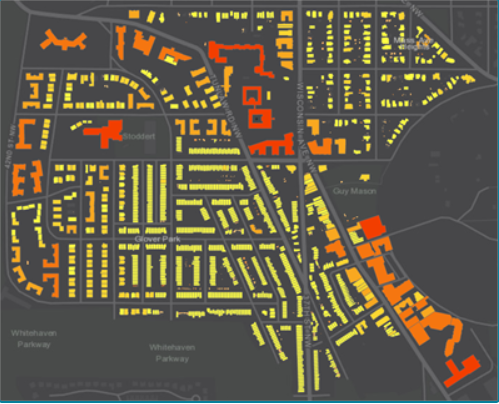
To solve complex location oriented problems, to find patterns, detect anomalies based on spatial data.
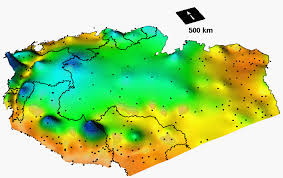
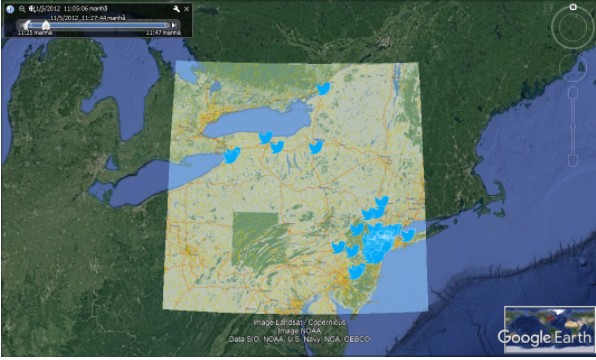
To visualize Geographic data in an interactive way so that the viewer gets the information in the first look.
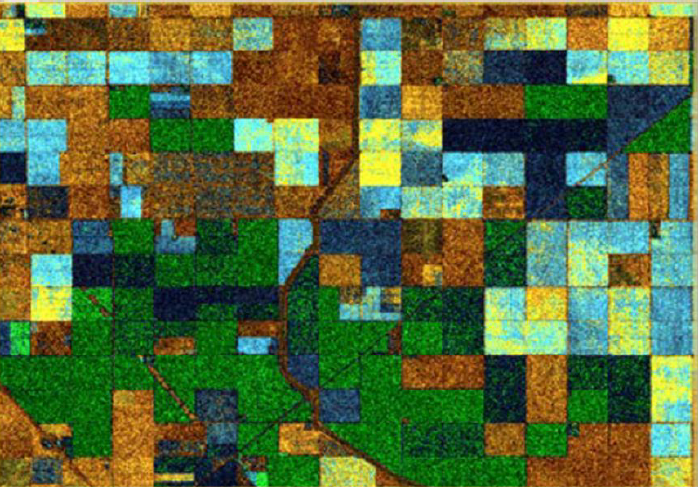
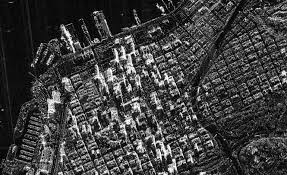
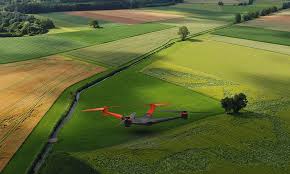
To perform highly accurate satellite image classification ,segmentation, clustering and change detection by applying deep learning techniques.
Geospatial data and analysis to calculate many of the SDG indicators.GIS is enabling people across many organizations and geographies to create useful data that contributes to the SDG framework, and ultimately helps to accomplish the 2030 agenda.
Integration of MIS and GIS data stores, delivering applications that meet the increasingly demanding analysis and reporting needs.
Would you like to know more or just discuss something?
I have worked on dozens of projects so I have picked only the latest for you.
The goal is to prove that InSAR is sensitive to the temporal evolution of crops and has potential for crop classification. A one-year time-series of Sentinel-1 INSAR images acquired over an agricultural area in the city of Hanford, King’s County, California . Results shows that interferometric coherence coefficient provide notable classification accuracy between 70-80% and use of all available intensity images perform best.
Crop calendar is well identified by the coherence magnitude. An important aspect that was observed is that polarization plays an important role in the idea that the behavior of both channels compliments one another, since it improves the accuracy of classification by simultaneously making use of the data of both polarizations.
The elevation and shape of the Earth's surface influences many, if not most aspects of land use, human mobility, settlement patterns, natural risks and many other key factors of regional Geography.
Digital Terrain/Elevation Models, typically in raster format and in a variety of spatial resolutions, serve as underlying representations of terrain elevation.
This map was build as to fulfill learning objective "interactive mapping" of Geoviualization and advanced cartography course.Leaflet is an open-source JavaScript library for creating interactive maps.This Leaflet map is fully interactive and include features such as:
Bluebikes is a public bike share system in Arlington, Boston, Brookline, Cambridge, Chelsea, Everett, Newton, Revere, Somerville, and Watertown. The company publish downloadable files of Bluebikes trip data each quarter.
The task was to fulfill the objective of visualizing a dataset through the best visualization techniques. Since both mapping and geographical data is available in this dataset, multiple graphs that visualize the dataset statistically and geographically were created. The software used for this purpose is Tableau which provided a sufficient platform for our objective.
RADAR imagery is a key element for hazard mapping. In this exercise, Sentinel-1 imagery was processed for detection of burned forested area.
Study area is located in Andalusia region, Spain. There was a forest fire on the summer 2017. The following pre- and post-event Sentinel-1 radar images were used to detect the burned area.
The objectives of the assignment was to establish WMS connection, request WMS image of user defined bounding box, store image locally into KML structure, display the stored image in google earth , visualize the tweets as a time series overlayed on the image. The code consist of three classes: